
Executive Summary
Paytm, India's largest digital payments platform, reported a 25% decline in Monthly Active Users — a metric at the heart of any consumer fintech business. For a company competing in one of the world's most contested payments markets, this is not just a number; it's a strategic red flag demanding immediate, structured investigation.
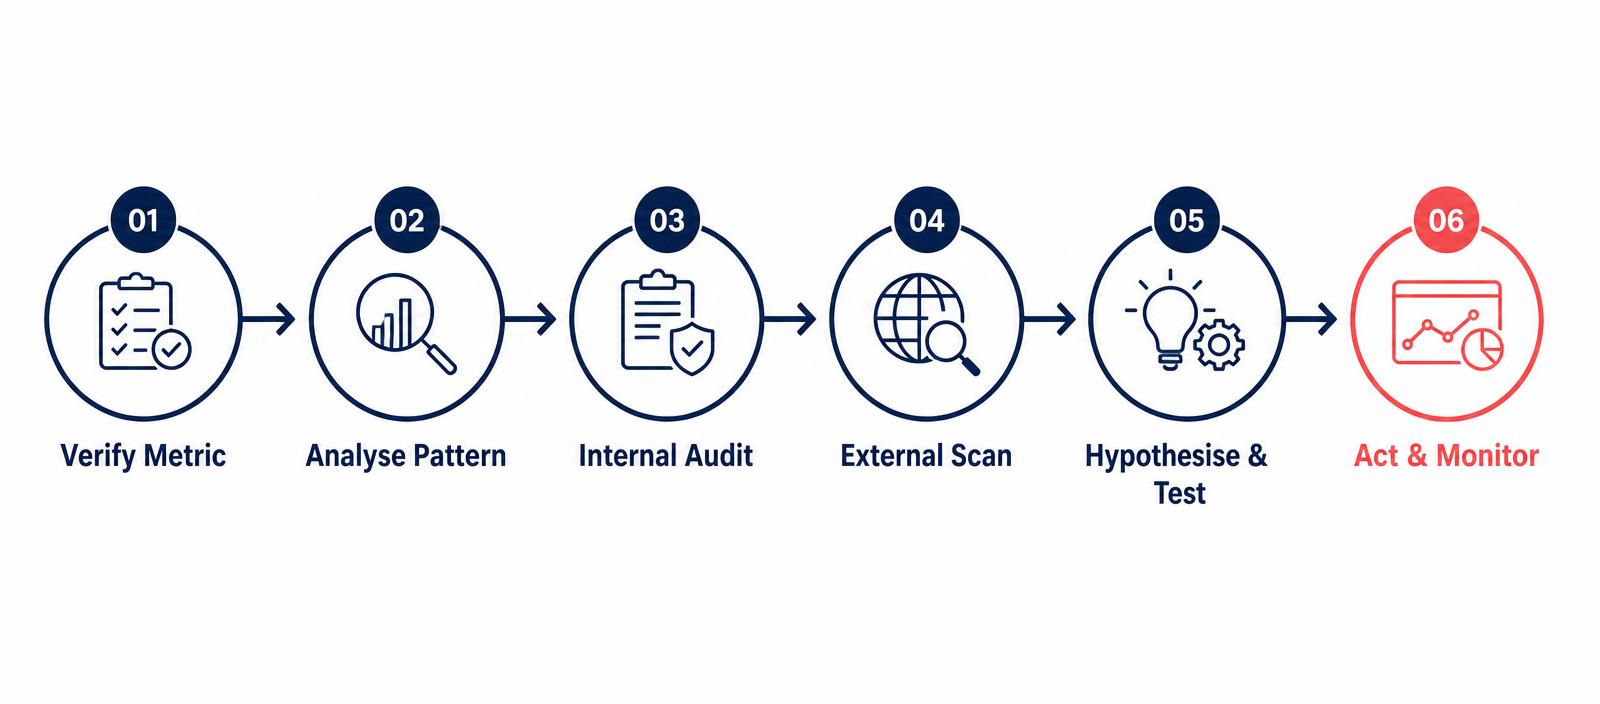
This case study walks through the exact diagnostic framework a PM should apply — from verifying data integrity, to identifying internal and external causes, to forming testable hypotheses and driving a recovery plan. The process is repeatable, scalable, and grounded in real-world product thinking.
Core insight: a drop in MAUs almost never has a single cause. The value of this framework is in surfacing multiple contributing factors simultaneously, so the team can prioritise fixes by impact.
Step 1 : Clarify & validate the metric
Never react to a number before you trust it. The first question any PM must ask is: is this number real? Metric anomalies caused by data pipeline failures, tagging errors, or reporting discrepancies are far more common than people admit — and acting on false data is expensive.
- → Confirm the 25% drop is not a dashboard or pipeline error
- → Validate scope: India-specific MAUs, not a global rollup
- → Cross-check with raw data exports and alternate BI tools
- → Verify the time window — rolling 30 days vs. calendar month
- → Ensure user definition is consistent (active = logged in? transacted?)
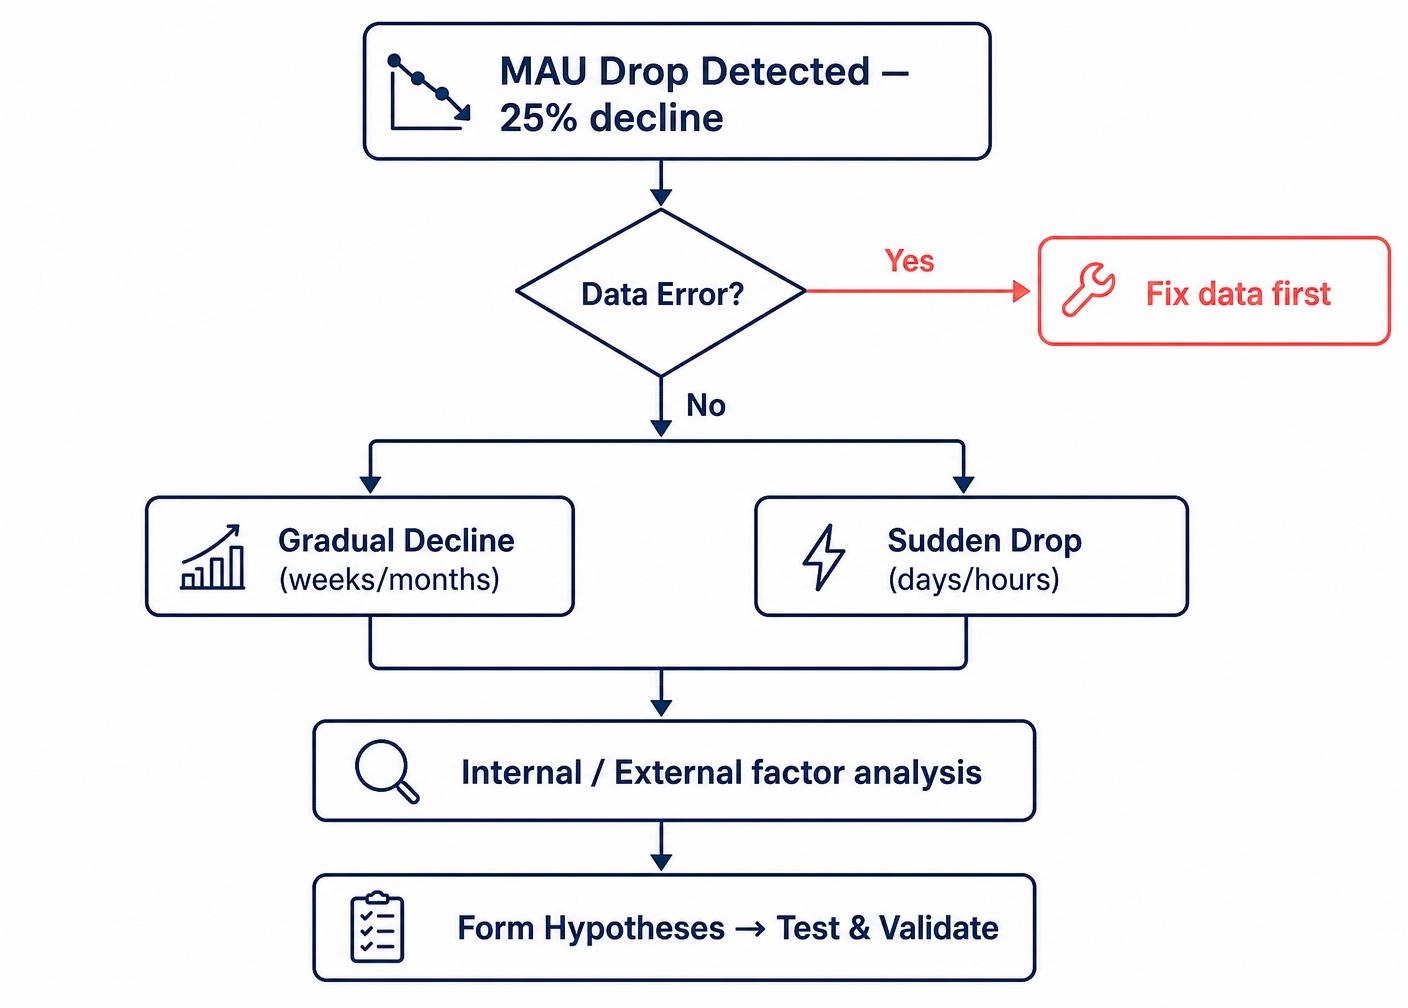
Diagnostic decision flowchart
A visual map of how to approach the investigation: validate the data first, then split the signal by its temporal shape, run the internal vs. external lenses in parallel, and converge on a small set of falsifiable hypotheses to test.
Step 2 : Analyse the pattern
Once the data is validated, the next lens is temporal pattern analysis. The shape of the decline gives powerful early clues about what might be driving it.
| Pattern | Likely root cause | Immediate next step |
|---|---|---|
| Sudden drop (days/hours) | Technical outage · Viral negative PR · Major competitor launch | Check error logs · App store reviews · Review recent deployments |
| Gradual decline (weeks/months) | Eroding product experience · Growing competition · Macro headwinds | Analyse retention cohorts · Review NPS/CSAT trends |
Sudden drop (days/hours)
- Likely root cause
- Technical outage · Viral negative PR · Major competitor launch
- Immediate next step
- Check error logs · App store reviews · Review recent deployments
Gradual decline (weeks/months)
- Likely root cause
- Eroding product experience · Growing competition · Macro headwinds
- Immediate next step
- Analyse retention cohorts · Review NPS/CSAT trends
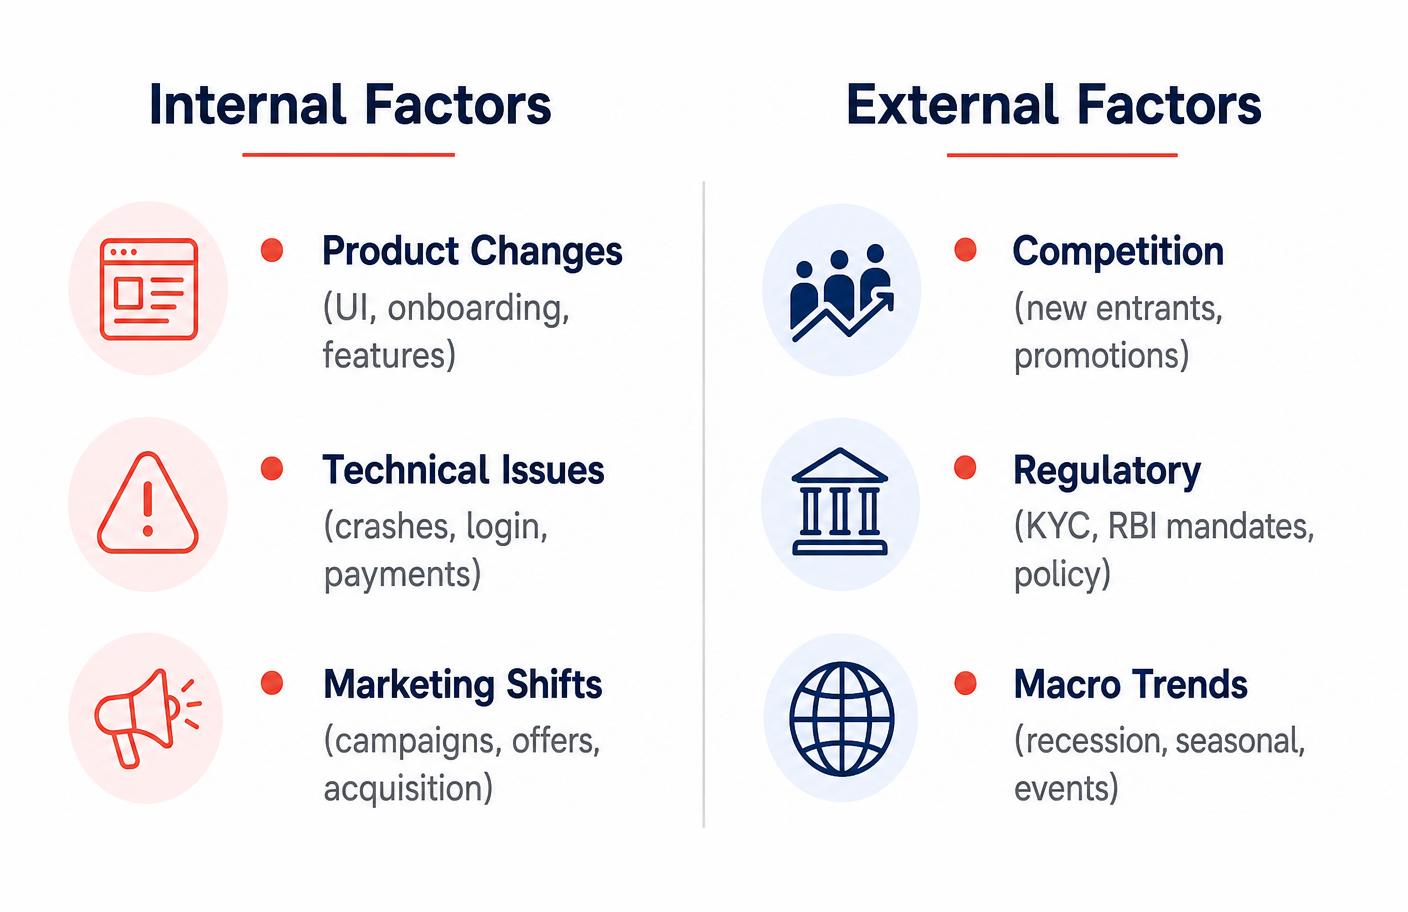
Step 3 : Internal factor analysis
Internal factors are your first port of call, they are within your team's control and can often be identified and fixed faster than external drivers. Walk three lenses in sequence: product, technical, and marketing.
- → Product — UI/UX changes shipped in the affected period, new onboarding or sign-up friction, high-traffic features removed or redesigned. Run A/B comparison: cohorts pre- vs. post-release.
- → Technical — crash and ANR rates by OS version, payment gateway success rates (the #1 churn driver), login failure and account recovery flows, segmented by device and app version.
- → Marketing — paid acquisition paused or cut, cashback or referral offers expired, channel-level attribution showing which source's contribution dropped most.
Step 4 : External factor analysis
External forces don't announce themselves , you have to go looking. Even a well-functioning product can haemorrhage users when the competitive landscape shifts or macro conditions change.
Competition: has PhonePe, Google Pay, or a new wallet launched an aggressive promotion? App store ranking changes and category download trends are the loudest signal.
Regulatory: the Indian fintech space is heavily regulated. A new RBI directive, tighter KYC, wallet balance limits — can create friction that quietly disengages passive users.
Macro: consumer spending is tied to confidence. A recessionary signal, unemployment spike, or national event can suppress transaction frequency, and active users who no longer transact simply stop opening the app.
Step 5 : Related metrics review
MAUs are a lagging indicator — they don't drop in isolation. A decline in the headline metric is almost always preceded by shifts in supporting metrics. Checking these gives you a fuller picture and narrows hypotheses significantly.
| Metric | What a drop here signals | Priority |
|---|---|---|
| Daily Active Users (DAU) | Core engagement collapsing — users aren't returning daily | Critical |
| Transaction Volume | Users active but not transacting — friction or trust issue | Critical |
| Session Length | Users open the app but disengage quickly — UX problem | High |
| Retention by Cohort | Specific cohorts churning fast — acquisition quality issue | High |
| CSAT / NPS | Leading indicator of churn before it shows in MAUs | Medium |
| App Store Rating | Public sentiment and bug reports surfaced organically | Medium |
| Churn Rate | % of users active last month but not this month | Critical |
Daily Active Users (DAU)
- What a drop here signals
- Core engagement collapsing — users aren't returning daily
- Priority
- Critical
Transaction Volume
- What a drop here signals
- Users active but not transacting — friction or trust issue
- Priority
- Critical
Session Length
- What a drop here signals
- Users open the app but disengage quickly — UX problem
- Priority
- High
Retention by Cohort
- What a drop here signals
- Specific cohorts churning fast — acquisition quality issue
- Priority
- High
CSAT / NPS
- What a drop here signals
- Leading indicator of churn before it shows in MAUs
- Priority
- Medium
App Store Rating
- What a drop here signals
- Public sentiment and bug reports surfaced organically
- Priority
- Medium
Churn Rate
- What a drop here signals
- % of users active last month but not this month
- Priority
- Critical
Step 6 : Hypothesis formation & testing
After gathering evidence from internal, external, and metric analysis, synthesise. Form specific, falsifiable hypotheses — not vague guesses — and assign a testing method to each. Prioritise A/B tests for product hypotheses, surveys for behavioural ones, log deep-dives for technical issues. Run your highest-confidence hypothesis first — speed matters in a crisis.
| # | Hypothesis | Test method | Signal to watch |
|---|---|---|---|
| H1 | A recent UI overhaul increased checkout friction | A/B rollback + funnel analysis | Conversion & cart abandonment |
| H2 | Competitor cashback pulled price-sensitive users | Category share data + churned-user survey | Competitor downloads & churn reason |
| H3 | Payment gateway failures caused abandonment | Server logs + gateway SLA review | PSP success rate & error codes |
| H4 | RBI KYC mandate created re-verification friction | Drop-off funnel at KYC screen | KYC completion & support tickets |
H1
- Hypothesis
- A recent UI overhaul increased checkout friction
- Test method
- A/B rollback + funnel analysis
- Signal to watch
- Conversion & cart abandonment
H2
- Hypothesis
- Competitor cashback pulled price-sensitive users
- Test method
- Category share data + churned-user survey
- Signal to watch
- Competitor downloads & churn reason
H3
- Hypothesis
- Payment gateway failures caused abandonment
- Test method
- Server logs + gateway SLA review
- Signal to watch
- PSP success rate & error codes
H4
- Hypothesis
- RBI KYC mandate created re-verification friction
- Test method
- Drop-off funnel at KYC screen
- Signal to watch
- KYC completion & support tickets
Step 7 : Action plan & recovery
Root cause identified. Now the real work begins. A structured recovery plan needs clear ownership, timelines, and success criteria — not a list of good intentions.
- → Technical fixes (0–2 weeks) — hotfix crashes, payment failures, login issues. Prioritise by frequency and revenue impact. Ship, don't perfect.
- → Product improvements (2–6 weeks) — roll back or iterate on UI changes that caused friction. Use A/B data, not opinions.
- → Marketing recovery (immediate) — re-engagement campaign targeting lapsed users, personalised by cohort. A churned power user needs different incentive than a casual transactor.
- → Regulatory compliance — if a regulatory change is the driver, build a smoother compliance flow that meets legal requirements without killing conversion.
- → Stakeholder communication — brief leadership with a clear narrative: what happened, why, what we're doing, when results land.
- → Monitor & iterate — daily war-room cadence for two weeks. Track leading indicators (DAU, session depth, transaction success) before MAU recovers.
Key takeaways for PMs
What this case study teaches beyond the Paytm context — a transferable framework for any metric drop on any consumer product.
- → Data integrity first — never skip validation. A reporting bug masquerading as a product crisis costs trust and resources.
- → Pattern is a clue — sudden vs. gradual tells you where to look first: tech vs. strategy.
- → Balance internal & external lenses — most teams over-index on internal fixes and miss the competitive context.
- → Hypothesise before you act — acting on instinct wastes sprints. One week of testing saves months of wrong execution.
- → MAU is a lagging indicator — by the time it drops, the real problem started weeks ago. Watch DAU, retention, and satisfaction proactively.
- → Recovery is iterative — there is no single fix. Monitor, learn, adjust. Make it a process.
In one line
"A drop in MAUs almost never has a single cause — the job is to surface the contributing factors fast enough that fixes can be sequenced by impact, not panic."